Overview
SmCCNet is a framework that adeptly integrates single or multiple omics data types along with a quantitative or binary phenotype of interest. It offers a streamlined setup process that can be tailored manually or configured automatically, ensuring a flexible and user-friendly experience. The algorithm is based on sparse multiple canonical analysis (SmCCA) and is designed for T omics data types X1, X2, ..., XT along with a quantitative phenotype Y. SmCCA identifies canonical weights w1, w2, ..., wT that maximize the sum of pairwise canonical correlations between the omics data and Y, subject to certain constraints. In SmCCNet, LASSO (Least Absolute Shrinkage and Selection Operator) is used as the sparsity constraint function.
The algorithm can operate in both weighted and unweighted modes, depending on whether ai, j and bi (scaling factors) are equal or not. When ai, j and bi are not all equal, it corresponds to the weighted version; otherwise, it corresponds to the unweighted version, where ai, j = bi = 1 for all i and j.
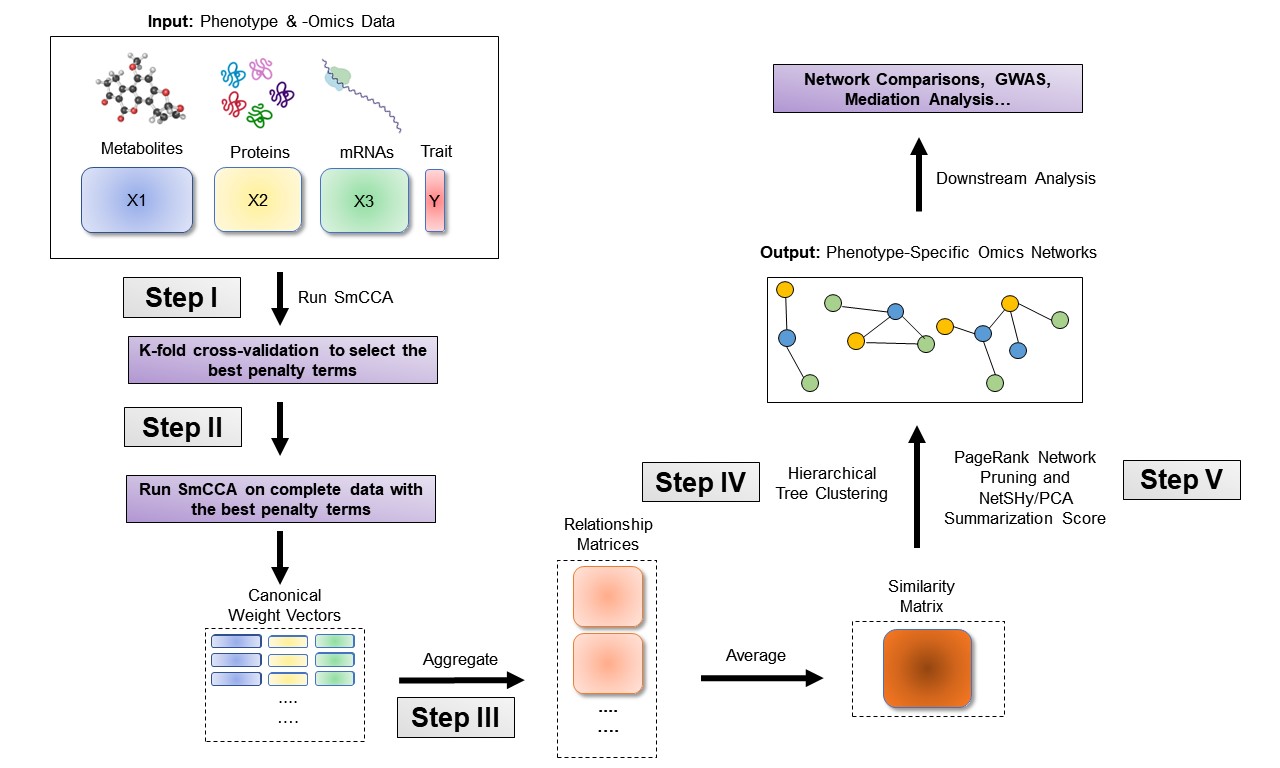
The sparsity penalties ct determine the number of features included in each subnetwork. SmCCNet follows a workflow that involves creating a network similarity matrix using SmCCA canonical weights from repeated subsampled omics data and the phenotype. It then identifies multi-omics modules relevant to the phenotype. The subsampling scheme enhances network robustness by analyzing a subset of omics features multiple times and aggregating results from each subsampling step.Below are the four steps of SmCCNet workflow
- Step I: Determine SmCCA sparsity penalties ct. The user can select the penalties for omics feature selection based on the study purpose and/or prior knowledge. Alternatively, one can pick sparsity penalties based on a K-fold cross validation (CV) procedure that minimizes the total prediction error. The K-fold CV procedure ensures selected penalties to be generalizable to similar independent data sets and prevents over-fitting.
- Step II: Randomly subsample omics features without replacement, apply SmCCA with chosen penalties, and compute a feature relationship matrix for each subset. Repeat the process many times and define the similarity matrix to be the average of all feature relationship matrices.
- Step III: Apply hierarchical tree cutting to the similarity matrix to find the multi-omics networks. This step simultaneously identifies multiple subnetworks.
- Step Iv: Prune and summarize each network with our network pruning algorithm.
SmCCNet Key Features
Unlock the Power of SmCCNet with These Key Features:
- 🧬 Multi-Omics Network Inference
- With Quantitative Phenotype
- With Binary Phenotype
- 📊 Single-Omics Network Inference
- With Quantitative Phenotype
- With Binary Phenotype
- 🚀 Automation Simplified
- Automated SmCCNet with a Single Line of Code
SmCCNet Network Visualization
The final network generated from SmCCNet can be visualized in two ways:
- Shiny Application simply by uplooding the final .Rdata to SmCCNet Visualization Application.
- Cytoscape Software Cytoscape through R package RCy3.


Package Functions
The older version of the SmCCNet package includes four (external) functions:
- getRobustPseudoWeights(): Compute aggregated (SmCCA) canonical weights.
- getAbar(): Calculate similarity matrix based on canonical weights.
- getMultiOmicsModules(): Perform hierarchical tree cutting on the similarity matrix and extract clades with multi-omics features.
- plotMultiOmicsNetwork(): Plot (pruned or full) multi-omics subnetworks.
In the updated package, all functions except for getAbar are retired from the package, additional functions have been added to the package to perform single-/multi-omics SmCCNet with quantitative/binary phenotype, and their use is illustrated in this vignette:
- aggregateCVSingle(): Saving cross-validation result as the cross-validation table into the working directory and provide recommendation on the penalty term selection.
- classifierEval(): Evaluate binary classifier’s performance with respect to user-selected metric (accuracy, auc score, precision, recall, f1).
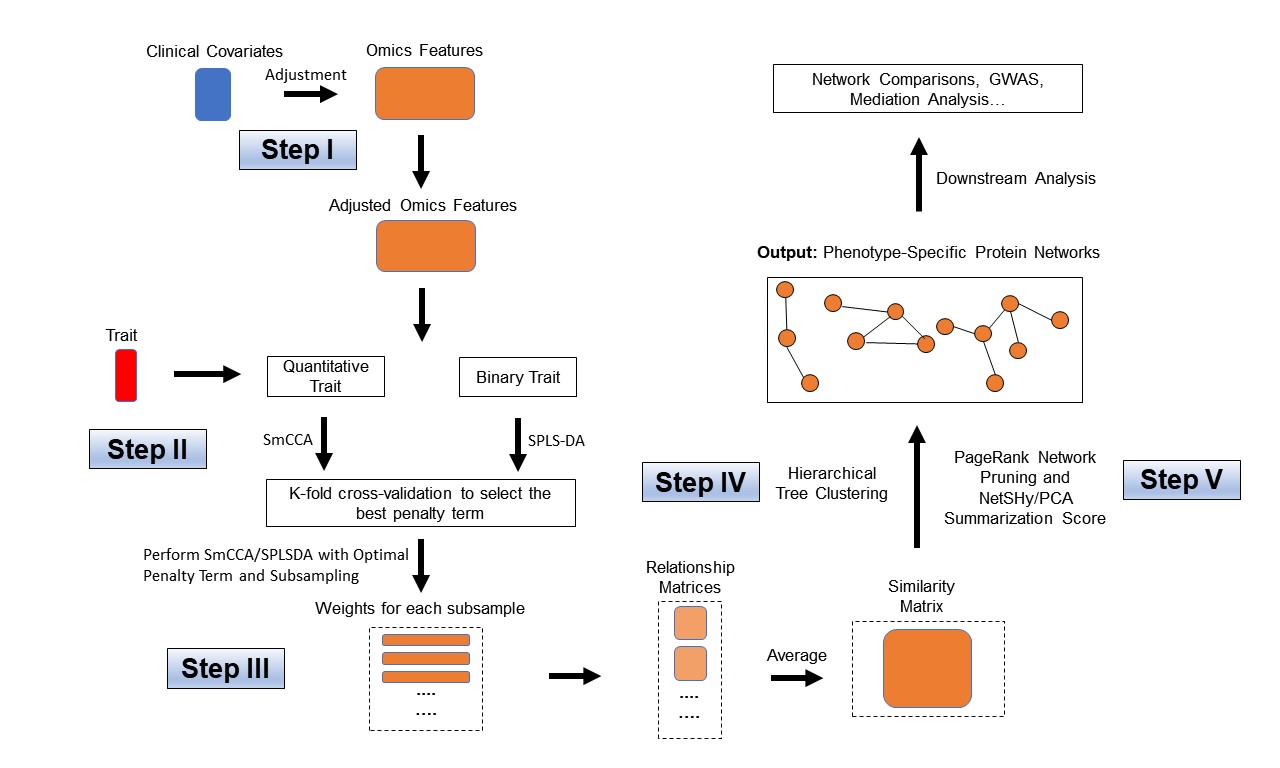
- dataPreprocess(): A simple pipeline to preprocess the data before running SmCCNet (center, scale, coefficient of variation filtering and regressing out covariates).
- fastAutoSmCCNet(): Automated SmCCNet automatically identifies the project problem (single-omics vs multi-omics), and type of analysis (CCA for quantitative phenotype vs. PLS for binary phenotype) based on the input data that is provided. This method automatically preprocess data, choose scaling factors, subsampling percentage, and optimal penalty terms, then runs through the complete SmCCNet pipeline without the requirement for users to provide additional information. This function will store all the subnetwork information to a user-provided directory, as well as return all the global network and evaluation information. Refer to the automated SmCCNet vignette for more information.
- getCanWeightsMulti(): Run Sparse Multiple Canonical Correlation Analysis (SmCCA) and return canonical weight.
- getCanCorMulti(): Get canonical correlation value for SmCCA given canonical weight vectors and scaling factors.
- getRobustWeightsMulti(): SmCCNet algorithm with multi-omics data and quantitative phenotype. Calculate the canonical weights for SmCCA.
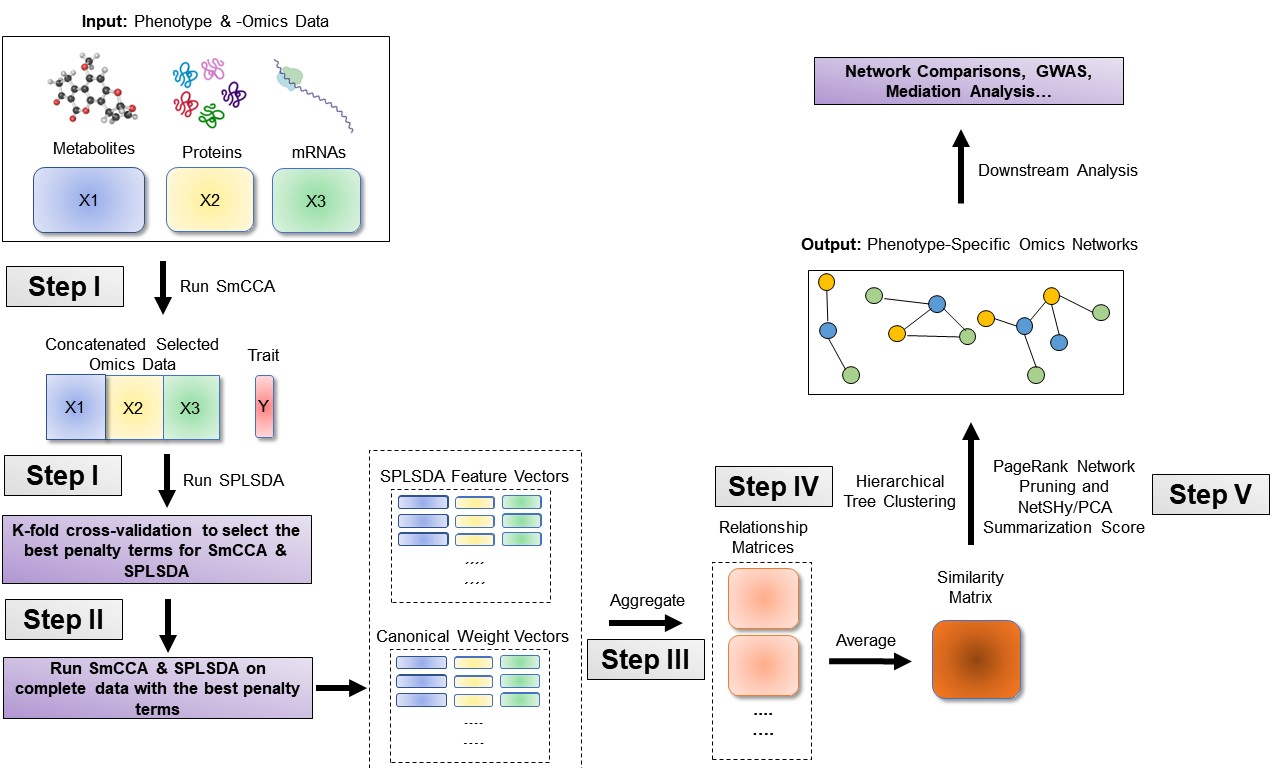
- getRobustWeightsMultiBinary(): SmCCNet algorithm with multi-omics data and binary phenotype. First, SmCCA is used to identify relationship between omics (exlude phenotype). Then, after highly connected omics features are selected in step 1, SPLSDA is used to identify relationships between these omics features and phenotype(s). The sparse PLSDA algorithm for binary outcome first compute PLS by assuming outcome is continuous, and extracts multiple latent factors, then uses latent factors to fit the logistic regression, and weights latent factor by regression parameters.
- getRobustWeightsSingle(): Compute aggregated (SmCCA) canonical weights for single omics data with quantitative phenotype.
- getRobustWeightsSingleBinary(): Compute aggregated (SmCCA) canonical weights for single omics data with binary phenotype.
- getOmicsModules(): Perform hierarchical tree cutting on the similarity matrix and extract clades with omics features.
- networkPruning(): Extract summarization scores (the first 3 NetSHy/regular prinicipal components) for specified network module with given network size. The omics features will be ranked based on PageRank algorithm, then the top m omics features (where m is the specified subnetwork size) will be included into the final subnetwork to generate the summarization score. For the PC score, the correlation with respect to the phenotype of interest will be calculated and stored. In addition, the correlation between individual omics features and the detected phenotype (with the Pheno argument) will also be recorded. The final subnetwork adjacency matrix will be stored into the user-specified working directory of interest.
- scalingFactorInput(): After inputing the annotation of omics data, it uses prompts to ask the user to supply the scaling factor intended for the SmCCNet algorithm to prioritize the correlation structure of interest. All scaling factor values supplied should be numeric and nonnegative.
- summarizeNetSHy(): Implement NetSHy network summarization via a hybrid approach to summarize network by considering the network topology with the Laplacian matrix.
Installation
# Install package
if (!require("devtools")) install.packages("devtools")
devtools::install_github("KechrisLab/SmCCNet")
# Load package
library(SmCCNet)
Usage
We present below examples of how to execute Automated SmCCNet using a simulated dataset. In this demonstration, we simulate four datasets: two omics data and one phenotype data. We cover four cases in total, involving combinations of single or multi-omics data with either a quantitative or binary phenotype. The final case demonstrates the use of the regress-out approach for covariate adjustment. If users want to run through the pipeline step-by-step or understand more about the algorithm used, please refer to SmCCNet single or multi-omics vignettes for details.
library(SmCCNet)
set.seed(123)
data("ExampleData")
Y_binary <- ifelse(Y > quantile(Y, 0.5), 1, 0)
# single-omics with binary phenotype
result <- fastAutoSmCCNet(X = list(X1), Y = as.factor(Y_binary),
                          Kfold = 3,
                          subSampNum = 100, DataType = c('Gene'),
                          saving_dir = getwd(), EvalMethod = 'auc',
                          summarization = 'NetSHy',
                          CutHeight = 1 - 0.1^10, ncomp_pls = 5)
# single-omics with quantitative phenotype
result <- fastAutoSmCCNet(X = list(X1), Y = Y, Kfold = 3,
                          preprocess = FALSE,
                          subSampNum = 50, DataType = c('Gene'),
                          saving_dir = getwd(), summarization = 'NetSHy',
                          CutHeight = 1 - 0.1^10)
# multi-omics with binary phenotype
result <- fastAutoSmCCNet(X = list(X1,X2), Y = as.factor(Y_binary),
                          Kfold = 3, subSampNum = 50,
                          DataType = c('Gene', 'miRNA'),
                          CutHeight = 1 - 0.1^10,
                          saving_dir = getwd(),
                          EvalMethod = 'auc',
                          summarization = 'NetSHy',
                          BetweenShrinkage = 5,
                          ncomp_pls = 3)
# multi-omics with quantitative phenotype
result <- fastAutoSmCCNet(X = list(X1,X2), Y = Y,
                          K = 3, subSampNum = 50,
                          DataType = c('Gene', 'miRNA'),
                          CutHeight = 1 - 0.1^10,
                          saving_dir = getwd(),
                          summarization = 'NetSHy',
                          BetweenShrinkage = 5)
Global network information will be stored in object ‘result’, and subnetwork information will be stored in the directory user provide. For more information about using Cytoscape to visualize the subnetworks, please refer to the multi-omics vignette section 3.1.
Getting help
If you encounter a bug, please file an issue with a reproducible example on GitHub. For questions and other discussion, please use community.rstudio.com.
This package is developed by KechrisLab, for more questions about the package, please contact Dr. Katerina Kechris or Weixuan Liu.